The center stage effect describes your tendency to choose options in the middle of a choice set. In some cases, these choices are low-risk: which route you drive to work, which pen you pull from the drawer. The center stage effect also influences which products you buy, which students you call on in class, or where you decide to sit during a job interview.
Last spring my boss gave away a small kids lawn chair to whomever picked the number between 1 and 100 closest to the number he had picked.
The chair matched two others I already had, so I wanted it. I made my guess with these assumptions in mind:
- The number he picked would represent middle-ness. He wouldn’t pick the number 5 or 95. Those numbers are at the extremes, so they don’t represent what it means to be between two numbers.
- The number 50 was too obvious an answer. It didn’t represent the middle. It was the middle.
- To represent middleness, the number would be located in the middle half of the range, between 25 and 75.
- The numbers 25 and 75 still seemed too obvious. They’re at the edge of the middle range.
- The number would be near the middle of the middle of the middle: roughly between 25 and 50 or 50 and 75: either 37.5 or 62.5.
- The number was more likely to contain a 7 than any other number. (A fair bit of research supports this, as we’ll see in a moment.)
- My colleagues might be making these same assumptions.
With these factors in mind, I chose the number 37.
(Spoiler: I got the chair.)
Preference for the Middle Option
All people behave in the same way when they pick a number between two other numbers. They’re biased toward the middle.
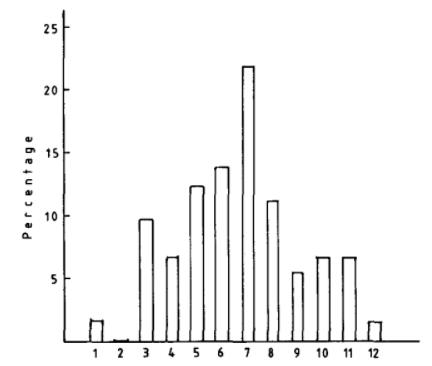
In one of the first studies to document this phenomenon, people were asked to pick a number between 1 and 12. 58.9% of the participants chose the numbers 5, 6, 7, and 8, which represented 33% of the possible choices. The effect was even more pronounced when participants were offered a cash prize for correct guesses: 76% choose one of the middle four numbers.1
More than just numbers
In a row of four bathroom stalls, people were almost twice as likely to choose the middle two than the outer two (60% vs. 39%). And among toilet dispensers in each stall, 62% of people chose from the two middle dispensers, compared to 39% who chose from the outer dispensers.2
In another study, researchers gave people household objects. They consistently showed a preference for middle options. In a set of three highlighters, 68% chose the middle. In a row of three chairs, 71% sat in the middle.3
Multiple choice tests are biased toward the middle
In a four-option multiple choice test, correct answers should be evenly distributed: 25% of the answers should be A, B, C, and D, respectively.
But test designers show a bias toward the middle, too. In a typical multiple choice test, 55% of correct answers are found in the middle two options. And when people are asked to craft a single multiple choice question and answer, 70% put the correct answer in one of the middle spots.
Test takers show an even greater bias toward middle answers than test designers. When they encounter a question to which they don’t know the answer, 77% choose a middle option. 30% more test-takers chose a middle option as an incorrect answer than an edge option as an incorrect answer.4
If you’re on a game show, stick to the middle
On The Weakest Link, contestants stand in a semicircle, like this:
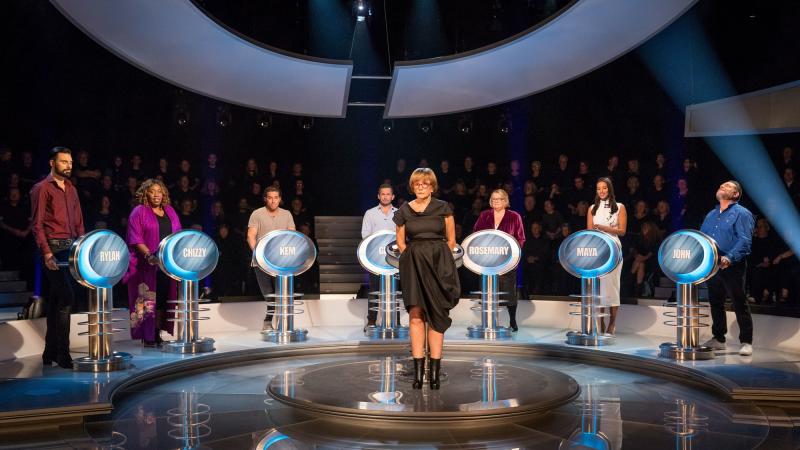
At the end of each round, the contestants vote someone–the weakest link–out of the semi-circle. With each successive round, the circle shrinks.
Researchers analyzed 20 episodes and found that players in the middle (positions 4 and 5) reached the final round 42.5% of the time, while people seated at the edge (positions 1 and 8) reached the final round only 17.5% of the time.5
You’re more likely to purchase items in the middle
When choosing between three packs of chewing gum, customers chose the middle option half the time, while 29.17% chose the left option and only 20.83% chose the right option.6
Retailers also found that moving toothbrushes from the top shelf to the middle shelf led to an 8% increase in sales.7
Many SaaS companies use the center stage effect on their pricing pages. Here’s Freshbook’s pricing page:

And, here’s The Economist’s pricing page:
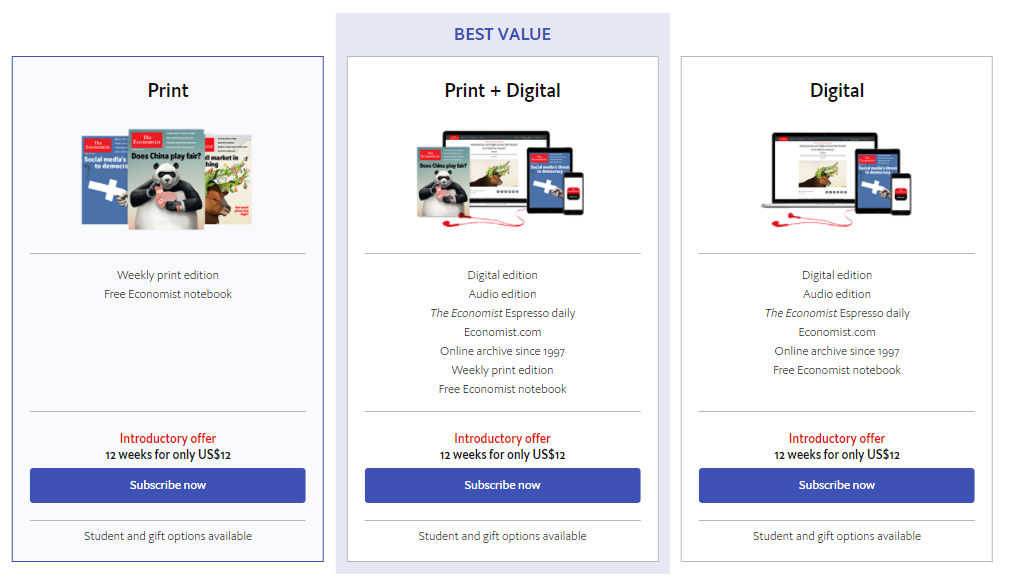
(This isn’t the first time The Economist has experimented with pricing. They have also used the decoy effect to influence which subscription customers buy.)
Your bias toward middle options affects which products you purchase, how much money you spend, and what kind of decisions you make in risky situations. It affects student behavior, game outcomes, and commuting decisions. This is called the center stage effect.
There’s something about the middle that overrides your rational decision processes.
But what?
Let’s take a look at how the center stage effect works. Here’s what we’ll cover:
- How where you look affects what you choose
- The feedback loop between your eyes and your brain
- Why you’re biased against options outside the middle
- The 2 exceptions to the center stage effect, and why they don’t follow the rules
- How to avoid falling for the center stage effect
Get more articles about cognitive biases, consumer psychology, and human behavior.
How where you look affects what you choose
Researchers have discovered a strong correlation between what you look at and what you choose. When you make a choice, you will gaze–either intentionally or unknowingly–at the item you eventually select. The item that gets the most attention gets chosen. You look more often at items you like.8
But the reverse is also true. You like items you look at.
This creates a feedback loop: looking at something causes you to like it, and liking it causes you to look at it more often.
This feedback loop is called the gaze cascade effect.9
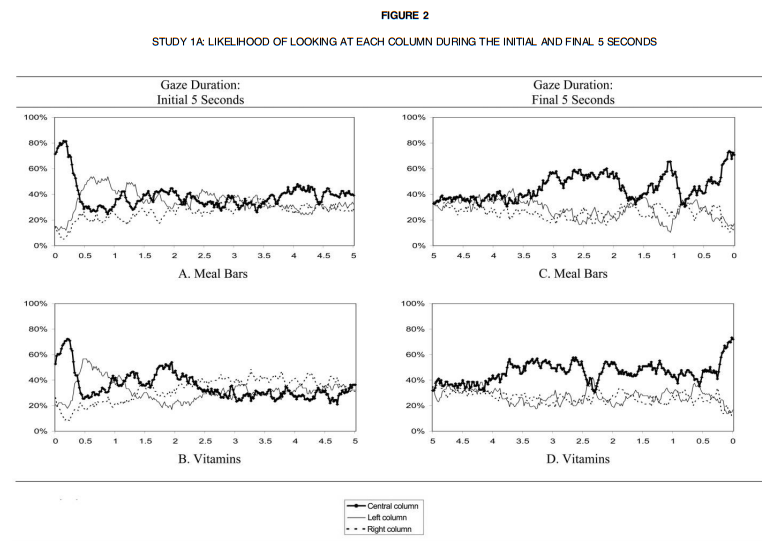
The gaze cascade effect is especially pronounced during the first few seconds you look at an object, regardless of how much time you spend making your decision. Even if you spend 30 seconds evaluating a set of objects, and even if you’re not cognitively aware of reaching a decision, it’s possible to predict which object you’ll choose in just the first 5 seconds.10
What starts the gaze cascade effect?
When you look at a scene, the first thing you look at is the center. The scene could be anything: a picture, a screen, the landscape in front of you, the menu at your favorite restaurant.11 This tendency to look at the center is called the central fixation bias. Even if there is important visual stimulus elsewhere in the scene—such as a person’s face—you still look in the middle before you look anywhere else.12
Here is an image of sequential fixation points on a scene using eye tracking technology. You can see the initial fixation at the center, as well as subsequent fixations, which still cluster near the center.
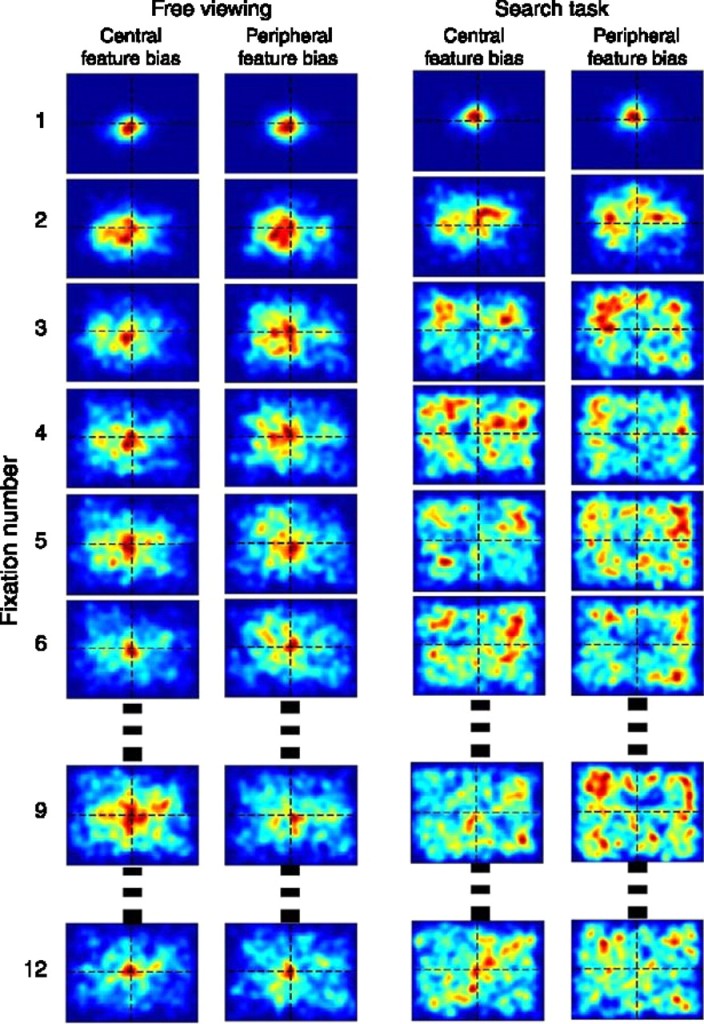
This initial fixation on the center provides the stimulus that triggers the gaze cascade effect—it’s what starts the feedback loop. Even just a few milliseconds of stimulus can be enough to trigger the gaze cascade effect and tilt the balance toward a choice. The feedback loop that reinforces the decisions you make is already operating before you are even conscious you need to make a decision.
Your eyes move faster than your brain
There’s a very slight delay between the world as it is and the world as you perceive it. This delay can be measured: it takes roughly 50 milliseconds for a stimulus to register above the level of consciousness. By the time you’re aware of something, it’s already 50 milliseconds in the past.
You can still process stimuli that occur in under 50 milliseconds. You just aren’t conscious you’re doing so.
After 50 milliseconds, as you become conscious of a stimulus, your brain rapidly identifies and categorizes it. You can identify a scene with 90% accuracy in about 80 milliseconds, and you can identify an advertisement within 100 milliseconds.
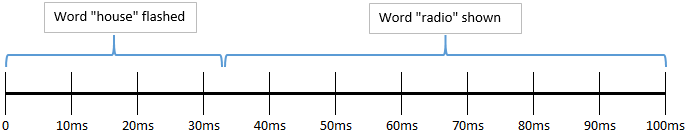
In one study, described in Stanislas Dehaene’s excellent book, Consciousness and the Brain, experimenters flashed the word house for 33 milliseconds—below the threshold of conscious awareness—and then followed it with a second word, such as radio, for a few seconds.
Participants were then asked to indicate whether the word they consciously saw–radio–was a living thing or an artifact.
When the first word—processed subconsciously—matched the second word, the response time increased. For example, when the subconscious word was radio, and the conscious word was also radio, it look less time for subjects to identify a radio as a non-living thing.
It’s as if the brain had begun processing traits about the subconscious stimuli, which made those same traits easier to identify after the subjects saw the same word later. Even though the participants did not realize they had really seen two words, the faster response time indicated that they had seen the first word and begun mentally processing it without being consciously aware of doing so.
When you see a scene–even before you’re consciously aware of it–your brain begins processing stimuli and beginning the initial steps of reacting to it, thereby shaping your reactions and decisions before you realize it.
Here’s Dehaene again, describing a study that showed the extent to which unconscious stimuli can shape behavior:
The subjects, upon seeing a “signal,” had to guess whether to press a button or refrain from pressing it. After each instance, they were told whether they had gained or lost money as a result of pressing or not pressing. Unknown to them, a subliminal shape, flashed within the signal, indicated the correct response; one shape cued the “go” response, another the “withhold” response, and a third was neutral—when it appeared, there was a 50 percent chance that either response would be rewarded.
After playing this game for a few minutes, subjects inexplicably got better at this task. They still could not see the shapes that were hidden within the signal, but they had the “hot hand” and began to earn a significant sum of money. Their unconscious value system had kicked in: the positive “go” shape began to trigger key presses, while the negative “withhold” shape evoked systematic withholding.13
Next time you are consciously aware you are looking at anything (such the words you are reading right now), your eyes have already registered the scene, fixated on the center, and triggered the gaze cascade effect—the feedback loop that influences the choice you will soon make.
Let’s summarize what this means for the center stage effect.
You’re already primed to choose a middle option because, by the time you’re conscious of doing so, you’ve already been looking at it. The gaze cascade effect–the powerful feedback loop that influences your choices–is triggered dozens of milliseconds before you’re aware of looking at anything, before you’re aware you need to make a decision, and before your cognitive, conscious, rational self can do anything to stop it.
Why you’re biased against options at the edges
Meanwhile, while your brain is directing your attention toward the center—consciously or not—there’s a parallel set of social and cultural norms actively biasing you against the edges.
Every day, you make assumptions about people, objects, or products based on their location relative to everyone or everything else. The center is positive, the edges are negative.
For example, the center of class is where the best students sit. The center chair is where the CEO sits. The middle chair is the where you sit if you want the job.
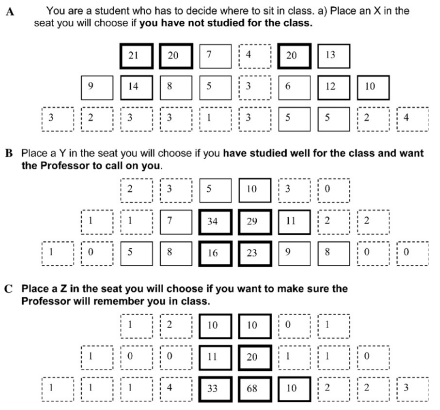
In one study, students were asked where they would sit in class to make sure the professor remembered them and called on them. A disproportionate number of students selected the seats at the front and center. Students were then asked where they would sit if they hadn’t come prepared, and most selected the back corners of the classroom.15
Subjects were also told they, along with two others, would take part in a group interview with a CEO and two product managers. They were asked where the CEO and product managers would likely sit, and where they would sit in response. A total of 38.8% of respondents chose this exact seating configuration:
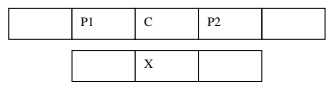
These examples are obvious to us because they represent self-reinforcing cultural norms: professors know the students who lurk near the edges aren’t as prepared as the students at the front and center; and the students know this, too. The CEO sits in the middle, and lower-rank employees sit near the edges. The players picked last are at the edge of the line-up. The least popular products are on the top shelf or the bottom shelf, farther out of reach.
These are basic social and cultural norms we all abide by.
These norms cause you to confuse the importance of a position’s location with the behavior of the position’s occupant. This location-based bias makes the behavior location-sensitive. The middle is slightly better than the edge.
The authors of the study conclude:
People substitute their schema that important [or good] people sit in the center, for individuating information about those in the center, leading them to direct less attention to their performance. When the task involved identifying performance failures, this confers those players in the center with a position advantage due to their errors being overlooked.16
The bias toward the center affects your memory
If someone at the center makes a mistake, you are less likely to recall it than if the same mistake was made by someone at the edge.
In fact, even if someone at the center does something good, you are still less likely to recall it.
You don’t just forget bad behavior from the center.
You forget all behavior from the center, because the information you get about the location supersedes information you get from the location.
The mere fact that something is at the center makes it unnecessary to pay attention to it.
The 2 exceptions to the center stage effect, and why they don’t follow the rules
It should be clear by now how and why you’re biased toward selecting middle choices.
At the same time, you’ve probably thought of an exception: a decision you made recently where you either weren’t biased toward the center.
You’re right. There are many decisions where you’re not biased toward the center:
- The first candidate listed on a ballot has a slight advantage over candidates listed in the middle or near the end.17
- At a restaurant, people are more likely to order food listed near the edges of the menu, not the middle.18
- In a study where people were asked to pick one of four identical socks, 40% chose the right-most option. (You can read more about this study in the post on the decoy effect.)
- Items at the edge of the salad bar run out more quickly than items in the middle.19
- A call to action on a landing page is more effective at the lower right than anywhere else, including the center.
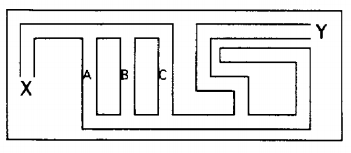
- When people are faced with choosing routes of equal length between point X and point Y in the diagram below, they are more likely to choose route C than route B (the middle).20
If the bias toward the middle is so strong, then why are there so many instances where you actively choose edge options?
It’s because there are two very specific kinds of choice sets where you are biased toward the first or last options (or the edges):
- The information is processed sequentially.
- The act of choosing is non-competitive.
Let’s take a look at each of these.
1. The center stage effect doesn’t apply when information about a choice set is processed sequentially
When you take in information sequentially—top to bottom or left to right—you’re more likely to choose either the first or last option.
In some instances, the items are evidently equal in that there is no evidence in favor of one item over another. For example, in a list of unfamiliar candidates on a ballot, each name is different from the others, but equally good or bad. There’s no evidence that elevates one over another. In this case, the first option exerts primacy over the others; simply the fact that it’s first makes it better. You find no evidence to unseat it as you read down a list of names you don’t recognize.
In other instances, the items are identical. In these cases, people are most likely to pick the last option, because is the most salient in their mind. For example, in one study, people were asked to choose from four identical socks. As people scanned from left to right, they ultimately chose the right pair more often, simply because it was more recent in their memory–even if only the fraction of a second less–the time it look to scan the row of socks.21
2. The center stage effect doesn’t apply when the act of choosing is non-competitive
Most choices from a set are made in a competitive environment, such as game shows, job interviews, multiple choice tests, shopping environments, and guessing games. What makes these environments competitive is the involvement of two or more parties in an outcome. The reason you choose middle options in competitive environments is because you want your choice to represent middle-ness.
Let me give you two examples:
- If I ask you to choose a number between 1 and 12, you’re more likely to pick 7 instead of 2 or 11, because 7 represents middle-ness. I wouldn’t pick 6 because it’s too easy, and you don’t pick six because you know that I know it’s too easy. But a number like 7 still represents middleness without being exactly in the middle.
- Multiple choice tests work the same way: part of the test-taker’s goal is to guess where the test creator would have placed the correct answer. And the test creator’s goal is to “hide” the answer somewhere. There’s a subtle strategy involved by both sides.
You mistake the representativeness of choices in the middle for the actual content of the choices. The more an competitive environment, the more likely the representativeness will affect what you choose. Choices made in non-competitive environments remove the impulse to choose a middle option.
How to avoid falling for the center stage effect
There isn’t an easy way to avoid the center stage effect. But there are two things you can do that will help.
Remember that the more you process information sequentially, the less likely you are to be biased toward middle options.
When you’re presented with options at once–as in a scene–do what you can to reimagine them in a sequential way, and aim to remove their order in the choice set as a factor in the decision process.
Finally, do what you can to take away the competitive nature of a decision. When you’re in a competitive environment, you make choices based on what those choices represent instead of the actual content of the choices themselves. Don’t aim for representativeness.
Get more articles about cognitive biases, consumer psychology, and human behavior.
- Teigen, K. (1983). Studies in subjective probability I: Prediction of random events. Scandinavian Journal of Psychology. ↩
- Christenfeld, N. (1995), Choices from Identical Options. Psychological Science. ↩
- Shaw, Jerry I., et. al.. (1998). Centrality Preferences in Choices Among Similar Options. The Journal of General Psychology. ↩
- Attali, Y. and Bar-Hillel, M. (2003). Guess Where: The Position of Correct Answers in Multiple Choice Test Items as a Psychometric Variable. Journal of Educational Measurement. ↩
- Valenzuaela, A. and Raghubir, P.. Position-based beliefs: The center-stage effect. Journal of Consumer Psychology. ↩
- Valenzuaela, A. and Raghubir, P.. Position-based beliefs: The center-stage effect. Journal of Consumer Psychology. ↩
- Dreze, X., Hoch, S. J., & Purk, M. E. (1995). Shelf management and space elasticity. Journal of Retailing. ↩
- Krajbich, I. (2010). Visual Fixations and the Computation and Comparison of Value in Simple Choice. Nature Neuroscience. ↩
- Shimojo, S. (2003). Gaze Bias Both Reflects and Influences Preference. Nature Neuroscience. ↩
- Atalay, A., Bodur, H. and Rasolofoarison, D. (2012). Shining in the Center: Central Gaze Cascade Effect on Product Choice. Journal of Consumer Research. ↩
- Tatler, B. (2007). The Central Fixation Bias in Scene Viewing: Selecting an Optimal Viewing Position Independently of Motor Biases and Image Feature Distributions. Journal of Vision. Tatler, B., Baddeley, R. and Gilchrist, I. (2005). Visual Correlates of Fixation Selection: Effects of Scale and Time. Journal of Vision. ↩
- Bindemann, M. (2010). Scene and screen center bias early eye movements in scene viewing. Vision Research. ↩
- Dehaene, S. (2014). Consciousness and the Brain: Deciphering How the Brain Codes Our Thoughts. New York: Viking Press. ↩
- A. Selin Atalay, H. Onur Bodur, and Dina Rasolofoarison (2012). “Shining in the Center: Central Gaze Cascade Effect on Product Choice.” Journal of Consumer Research. ↩
- Priya Raghubir and Ana Valenzuela (2006). “Center-of-inattention: Position biases in decision-making.” Organizational Behavior and Human Decision Processes. ↩
- Priya Raghubir and Ana Valenzuela (2006). “Center-of-inattention: Position biases in decision-making.” Organizational Behavior and Human Decision Processes. ↩
- Koppell, J. G. S., & Steen, J. A. (2004). “The effects of ballot position on election outcomes.” The Journal of Politics. ↩
- Dayan, E., & Bar-Hillel, M. (2011). “Nudge to nobesity II: Menu positions influence food intake.” Judgment and Decision Making. ↩
- Rozin, P., Scott, S., Dingley, M., Urbanek, J. K., Jiang, H., & Kaltenbach, M. (2011). “Nudge to nobesity I: Minor changes in accessibility decrease food intake.” Judgment and Decision Making. ↩
- Christenfeld, N. (1995), “Choices from Identical Options.” Psychological Science. ↩
- Nisbett, R. E., & Wilson, T. D. (1977). Telling more than we can know: Verbal reports on mental processes. Psychological Review. ↩
