The menu at Starbucks is designed with one thing in mind: to make you feel better about buying coffee at Starbucks. And it doesn’t hurt if it gets you to spend a little more—while making you feel like you spend less.
There are lots of ways Starbucks gets you to do this. Among the more subtle ways? Applying insights from psychology and decision theory to their menu design.
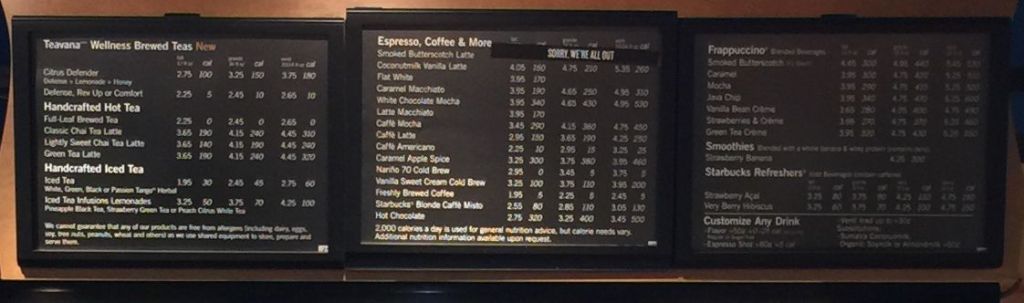
As an example, here’s the menu from my local Starbucks:
You might be thinking, wait a second, the menu at my local Starbucks looks different.
You’re right. Menus vary by region and location. The Starbucks down the street has a different menu from the Starbucks in your grocery store, which has a different menu from the Starbucks in the airport. Prices vary across regions and countries, too.
But all Starbucks menus share a similar design philosophy. The experience of processing information on the menu remains the same, even if particular menus are organized differently. (It’s not just Starbucks. Other restaurants do the same thing in their menu design.)
To understand how they do it, we need to take a deep dive into 6 psychological tactics behind Starbucks menu design:
- Why you like the drinks at the center of the menu
- Why you’re most likely to select the Grande size
- Why looking at three columns of prices makes you spend more
- How Starbucks uses the attraction effect to frame your choice between a Grande and a Venti size
- Why the Starbucks menu doesn’t include a dollar sign
- Why Starbucks prices end in .95 instead of .99
But before we look at how this works, there is one big question we need to address: Is somebody at Starbucks really strategizing about all this little stuff?
You bet.
And even if they aren’t—even if this menu was produced by chance—your drink choice would still reflect the same set of biases. If insights about human behavior inform how Starbucks designed their menu, then that’s good strategy. And if insights about human behavior do not inform how Starbucks designed their menu, then it’s a happy accident.
Either way, how the menu is designed doesn’t matter. That’s because, as you’ll see, the biases that influence your drink choice don’t require agency or intentionality in the menu design process. They only require a human brain on the receiving end.
(Yours.)
Let’s see how they do it.
1. Why you like the drinks at the center of the menu
You might not know it—or know why—but you like drinks in the center of the menu.
You’re not alone. Everyone loves middle options:
- In a row of four bathroom stalls, 60% of people choose the middle two stalls.1
- Retailers found that moving toothbrushes from the top shelf to a middle shelf led to an 8% increase in sales.2
- In a normal four-option multiple choice tests, 55% of the correct answers are found in the middle options.3
- Even on game shows, contestants who are seated in the middle are more likely to advance in the game and win. Over 20 episodes of The Weakest Link, players in the center positions reached the final round 42.5% of the time, while players at the edge made it only 17.5% of the time.4
You love middle options for a simple reason: there’s a feedback loop between looking at something and liking it. If you look at an object, you will like it more. And if you like an object, you will look at it more. It’s self-reinforcing.
In fact, if it takes you 30 seconds to make a choice, it’s possible to predict in just the first few seconds what you’ll choose, just by observing which object your eyes linger on most. You’ve often made your choice long before you realize it.
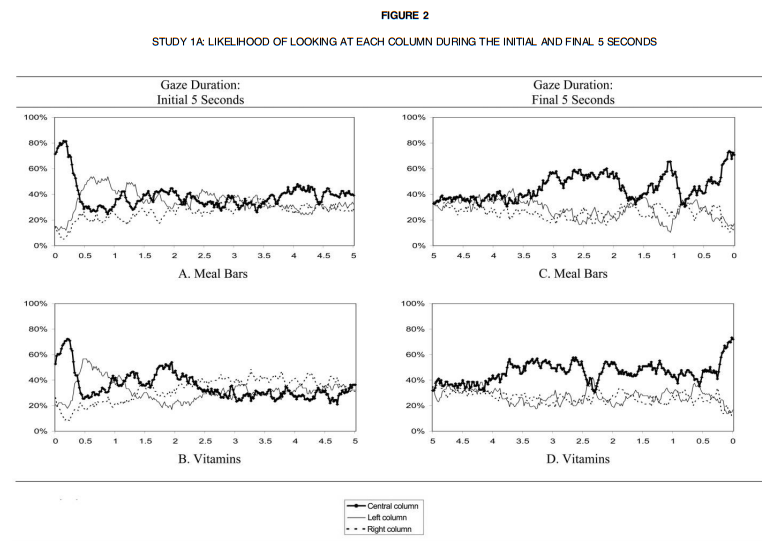
Take a look at this chart which shows what people look at when choosing between three things. The center object gets the most attention in the first few seconds:
But what starts the feedback loop? Do you look at something first, which causes you to like it? Or do you like something first, which causes you to look at it more?
It turns out it’s the former.
Within just a few milliseconds of looking at something, your eyes fixate on the center without you being consciously aware of it.
This might not seem like a big deal until you realize it takes around 50 milliseconds for something to register above the surface of consciousness. Less than 50 milliseconds, and the stimulus is too brief for you to consciously notice it. More than 50 milliseconds, you start to notice it.
This means by the time you hit the 50 millisecond mark, you have already been subconsciously looking at the center for 30–40 milliseconds—and starting to like it—all before you’re consciously aware of looking at anything.
Your tendency to look at the middle of a scene—a picture, a choice set, a menu—is called the center stage effect, and you can learn more about how it works here.
Take a look at the Starbucks menu again:
Whichever iteration of Starbucks’ menu you look at, you will focus on the middle before the edges. You look at middle rows before the top and bottom rows. And you look at middle prices before you look at cheaper or more expensive options.
It doesn’t matter what’s in those positions. The middle is where your eyes go first. Even if you’ve walked into Starbucks already know what drink you’ll order, you’ll still look at the middle. Your cognitive, rational self fights with the subconscious, biased self.
Because you’re so biased toward items at the middle, Starbucks is very strategic about what it puts there.
2. Why you’re most likely to select the Grande size
While the center stage effect biases you toward middle options, there’s also a simultaneous bias that steers you away from the edges.
People don’t choose big options or small options. This tendency is called the compromise effect, because it means compromising between two extremes.
Marketers exploit your desire to compromise by starting with the product they want you to buy, and construct extremes around it to make it more appealing.
In one study, people were presented with a choice between two cameras. Half of the group chose one, and half chose the other one.
But then a third camera was added. Now, most people chose the middle option.5
| Camera | Price | Group 1 | Group 2 |
| Minolta X-370 | $169.99 | 50% | 22% |
| Minolta Maxxum 3000i | $239.99 | 50% | 57% |
| Minolta Maxxum 7000i | $469.99 | — | 21% |
In another experiment, people were presented with different sets of three calculators. The extremes were moved around to make various compromise products more appealing.
Once again, regardless of which set they saw, people preferred the middle option and avoided the extremes.
| Product | Number of functions | Chances of defect in 2 years (%) | Set 1 | Set 2 | Set 3 |
| Calculator 1 | 8 | 1 | 5 | — | — |
| Calculator 2 | 16 | 3 | 48 | 26 | — |
| Calculator 3 | 24 | 5 | 47 | 45 | 36 |
| Calculator 4 | 32 | 7 | — | 29 | 40 |
| Calculator 5 | 40 | 9 | — | — | 24 |
The same thing happened when consumers were presented with a choice of three tabletop grills:
| Product | Cooking area (square inches) | Weight (lb.) | Set 1 | Set 2 | Set 3 |
| Grill 1 | 160 | 4 | 31 | — | — |
| Grill 2 | 220 | 7 | 40 | 27 | — |
| Grill 3 | 280 | 10 | 47 | 44 | 26 |
| Grill 4 | 340 | 13 | — | 29 | 47 |
| Grill 5 | 400 | 16 | — | — | 26 |
Until the mid-1990s, Starbucks offered three drink options: Short, Tall, and Grande. Most people avoided the extremes–Short and Grande–and ordered Tall drinks.
But when Starbucks dropped the Short size from the menu and added the Venti size, the Grande became the middle—and most frequently selected—option. (You might not know the Short size still exists. It’s just unlisted.)

(This morning I witnessed a conversation where one person offered to buy the other person a coffee at Starbucks. Her reply, word for word: “I’ll take the medium size. Is that a 16 ounce or a 20 ounce? Do they call them Ventis? I can’t remember. Just get me the middle one.)
2 causes of the compromise effect
Why do people choose a compromise option?
You would expect 33% of people would choose each option. That’s not what happens, and there are two reasons why.
1. The compromise effect is caused by your desire to avoid loss.
The compromise effect is related to your desire to avoid loss, known as loss aversion.
Several experiments have confirmed that people feel losses twice as worse than their corresponding gain. A $10 loss feels twice as bad as a $10 gain feels good. When a decision is framed as a loss, people go to great lengths to avoid it. (You can read more about this in the article on the decoy effect.)
Here’s how this works at Starbucks.
Let’s assume a latte is 25¢ per ounce. That makes a Tall $3.00, a Grande $4.00, and a Venti $5.00. Extreme choices entail a loss. Choosing a Tall instead of a Venti means you lose 8 ounces, while choosing a Venti instead of a Tall means you lose $2.00.
But which loss do you feel as worse? The loss of money? Or the loss of drink quantity? Would you rather lose a little money and get a larger drink, or would you rather spend less money but lose part of your drink?
It turns out the loss of quantity or quality looms larger than the loss of money.
Because you are more averse to low quality than high price, you’re biased against the lowest priced option, and compromise with a middle option.
That explains why you don’t choose the small extreme.
But what about the large extreme?
2. The compromise effect is caused by your desire to justify your choice
Part of what makes the compromise effect so powerful is that it allows you to rationalize your decision. Every choice you make requires a justification: why do you do what you do?
You justify your choice to yourself
In one study, Itamar Simonson had people talk aloud while making a choice between three items. People were more likely to mention how difficult the decision was, and weigh advantages and disadvantages. They also justified their decision with reasons such as:
- “I’ll take the middle alternative”
- “Because it is a compromise”
- “The one that is a combination of the two”
- “I’ll settle for B”
A significant reason for choosing a compromise option is because you’re seeking to justify the decision to yourself. In a way, it’s as if you are dealing with two selves: the self making the decision, and the self evaluating the decision.
He found that, when people chose a compromise option, the decision takes 71% longer than average.6
You justify your choice to others
When you make a choice for yourself, you’re somewhat uncertain of the outcome, even if only a little, and this uncertainty makes you more likely to choose a middle option.
But even more uncertain than choosing for yourself is choosing for someone else.
Sometimes it’s hard enough to know what you want. How can you tell what someone else wants? When you make a choice for yourself, you only need to justify your choice to yourself. But when you make a choice for someone else, you need to justify your decision to them.
You also have more to lose. There’s more risk you’ll get it wrong.
This uncertainty makes you even more likely to choose a compromise choice when choosing for someone else. That’s because a compromise is the safest choice, “minimizing the maximum potential error.”7
A middle choice might still be wrong, but if it is, then it’s the most likely to be the least wrong.
Here’s what this means: the more uncertainty involved in a decision, the more likely you’ll compromise with a middle option.
One study also found that the strength of compromise effect is correlated with how well you know the person for whom you are choosing. That’s because, for people you don’t know well, there is more uncertainty about what that person wants, and there is more risk in getting it wrong. You’re more likely to choose a compromise option.8
But for people you know very well, you are less likely to choose a compromise option.
That’ why, when you’re buying coffee for someone else, you will likely choose a drink from the middle section of the menu, and you will choose a Grande size.
3. Why looking at three columns of prices makes you likely to spend more
So far we’ve been talking a lot about the middle. But what about left and right options?
Starbucks offers three drink sizes at three prices, with the small price on the left and the large price on the right. This isn’t unique to Starbucks; any time you’re presented with a choice set with three options, it probably follows the smaller-on-the-left rule.
But why?
Neuroscientists have found that you perceive numbers on a linear scale with small numbers at the left, medium numbers in the middle, and large numbers at the right. Stanislas Dehaene and his colleagues have found that “people can identify and process larger numbers 30 milliseconds faster when they are on the right, and they can process smaller numbers 30 milliseconds faster when they are on the left.”9
Remember, 30 milliseconds is still slightly below the surface of consciousness. This means the left-to-right orientation happens at an automated, preconscious level.
Numbers are easier to process when they’re positioned in a choice set in the same way your brain processes them.
There’s even more going on.
We’ve seen that you look at the center first. But the second place you look is the left. That means the center price anchors both the smaller price (making it feel larger) and the larger price (making it feel smaller).
How does this work?
In one of the first experiments to document the anchor effect, psychologists Amos Tversky and Daniel Kahneman asked subjects to do two things:
- Spin a wheel of fortune that would stop on a number between 0 and 100.
- Guess the number of African countries in the United Nations.
What the people in the experiment didn’t know was that the wheel was rigged to stop at either the number 10 or the number 45. Tversky and Kahneman found that the number people guess was highly correlated to the number they spun.
When the wheel stopped at 10, people guessed there were 25 African countries in the United Nations. But when the wheel stopped at 65, people guessed there were 45 African countries in the United Nations.10
| Anchor | How many African countries in the United Nations? |
| 10 | 25 |
| 65 | 45 |
Why is this? When you don’t know the answer to the question, you look for a reference point—a clue that indicates where the answer might be.
Sometimes these reference points make sense. If you’ve ever been lost in a small European village, the church steeple is the reference point. If you’ve walked into a grocery store looking for apples, and you see bananas, it means the apples probably aren’t far away. Bananas are the reference point for fruit. Every day, you find answers and solve problems by taking steps that get you closer to answer before you actually reach it.
Anchors can trick your brain by giving you a reference point unrelated to the real answer.
In the example of the number of African countries in the United Nations, the number 10 “pulled down” the guess to 25. And the number 65 “pulled up” the number to 45.
(You can learn a lot more about anchors in my post on the psychology of .99-ending prices.)
Stanislas Dehaene and his colleagues also found the left-to-right orientation was reversed in countries that read from right to left, such as Arabic. However, Starbucks menus in Middle Eastern countries retain the left-to-right price orientation.11 I’m not sure why.
4. How Starbucks uses the attraction effect to frame your choice between a Grande and a Venti size
In theory, the market share for each drink should be 33.3%. But in practice, that’s not what happens. Starbucks prices drinks in a way that selective steers you toward larger options. Here’s how.
Imagine a scenario where you choose from these three coffees. The price per ounce is the same for each drink. Your only decision is how much you want to drink. Across a group of 100 customers, you would expect one third to choose each size, like this:
| Price per drink | Number of customers | Revenue | |
| Tall | $2.00 | 33 | $66.00 |
| Grande | $2.66 | 33 | $87.78 |
| Venti | $3.33 | 34 | $113.22 |
| TOTAL | $267.00 |
Now, let’s change the price. We’ll drop the price of the Grande and the Venti a little, so it looks like this:
| Price per drink | Number of customers | Revenue | |
| Tall | $2.00 | 20 | $40.00 |
| Grande | $2.60 | 50 | $130.00 |
| Venti | $3.25 | 30 | $97.50 |
| TOTAL | $267.50 |
Now Grande is a better deal than the Tall, and the Venti is a better deal than the Grande. When you look at this choice set, you still need to decide how much you want to drink, but the better value at the higher price will begin to bias you toward more expensive, larger drinks. However, the total revenue is still roughly the same.
Let’s make one more change. We’ll leave the price of the Tall and the Grande, but we’ll lower the Venti price a little more:
| Price per drink | Number of customers | Revenue | |
| Tall | $2.00 | 0 | $0 |
| Grande | $2.60 | 50 | $130.00 |
| Venti | $2.95 | 50 | $142.50 |
| TOTAL | $277.00 |
The Tall is still the same price as it’s always been, but it no longer looks like a great deal. Dropping the Venti price makes the Tall an undesirable choice, thereby turning a three-way choice into a two-way choice between the two most expensive options.
In this third scenario, by dropping the Venti price to make it closer to the Grande price, Starbucks has bumped up revenue from $267.00 to $277.00. That’s a 3.7% increase, just for using a price change to reframe a decision.
To simply what’s happening: the distance between the Tall and the Grande is much greater than the distance between the Grande and the Venti. This effectively excludes the Tall from your choice set.
This is called the attraction effect.
The examples I gave are made up, just to illustrate the phenomenon. But, as you can see, Starbucks does this at varying levels with its drinks. This table ranks how much the attraction effect is used for each drink. The ratio listed in the right column indicates where the Grande lies between a Venti (0) and a Tall (1). For example, if a Caramel Apple Spice were priced exactly between a Venti and a Tall, it would be a 0.5. But, at 0.29, it’s much closer to a Venti.
| Tall (12 oz.) | Grande (16 oz.) | Venti (20 oz.) | Price difference: Tall and Grande | Price difference: Grande and Venti | Ratio between differences | |
| Flat White | $3.95 | $0.00 | $0.00 | na | na | na |
| Caramel Apple Spice | $3.25 | $3.75 | $3.95 | $0.50 | $0.20 | 0.29 |
| Vanilla Sweet Cream Cold Brew | $3.25 | $3.75 | $3.95 | $0.50 | $0.20 | 0.29 |
| Hot Chocolate | $2.75 | $3.25 | $3.45 | $0.50 | $0.20 | 0.29 |
| Caramel Macchiato | $3.95 | $4.65 | $4.95 | $0.70 | $0.30 | 0.30 |
| White Chocolate Mocha | $3.95 | $4.65 | $4.95 | $0.70 | $0.30 | 0.30 |
| Caffe Americano | $2.25 | $2.95 | $3.25 | $0.70 | $0.30 | 0.30 |
| Narino 70 Cold Brew | $2.95 | $3.45 | $3.75 | $0.50 | $0.30 | 0.38 |
| Starbucks Blonde Café Misto | $2.55 | $2.85 | $3.05 | $0.30 | $0.20 | 0.40 |
| Freshly Brewed Coffee | $1.95 | $2.25 | $2.45 | $0.30 | $0.20 | 0.40 |
| Coconut Milk Vanilla Latte | $4.05 | $4.75 | $5.35 | $0.70 | $0.60 | 0.46 |
| Caffe Mocha | $3.45 | $4.15 | $4.75 | $0.70 | $0.60 | 0.46 |
| Caffe Latte | $2.95 | $3.65 | $4.25 | $0.70 | $0.60 | 0.46 |
5. Why the Starbucks menu doesn’t include a dollar sign
Starbucks excludes any indication of currency, because currency symbols get you to think about money. And the more you think about money, the less likely you are to spend it.
You might be thinking that something as small and unnoticeable as a currency symbol couldn’t affect your spending habits. Not once in your life have you probably noticed either the presence or absence of a currency symbol at Starbucks, or considered that it might change your purchasing behavior.
However, there’s a well-known study conducted by Cornell University that indicates otherwise. In the study, customers at a restaurant were shown multiple versions of a menu:
| How price is displayed | |
| With dollar sign | $20.00 |
| Without dollar sign | 20 |
| Word written out | twenty |
All three communicate the same thing: the price of this meal is twenty dollars. But each way of communicating the price elicited a different response from customers: the group of customers who didn’t see a dollar sign spent 8.1% more per person.12
The researchers conclude:
“Although the semantic meaning underlying each price presentation is the same, the differences in salience imply that various presentation styles may generate different levels of attention, awareness, and attitude in some consumers. . . . Customers will notice, remember, and dwell on prices differently depending on how they are stated.”
In another experiment, grocery stores were trying to figure out how to sell more soup. They observed how people responded to products in different environments:
“My guide explained the exercise: ‘Yesterday we ran exactly the same offer, with two distinct differences. There was a dollar sign in front of the price, and no ‘Maximum 3 cans per customer’ line. We also gave the shoppers smaller-sized carts and changed the floor tiles.’ These seemingly small changes translated into big differences. On the first day of the experiment, only 1 in 103 purchased Campbell’s soup. Today, however, it seemed that 1 in every 14 succumbed—a sevenfold increase.”13
Why do dollar signs affect how you spend money, even if only slightly?
It’s because the dollar sign is a symbol of cost. It’s negative. It’s a small reminder that you’re spending. It reframes the transaction around what you’re losing instead of what you’re getting.
In one of the first studies to document this, subjects were asked to perform tasks while, unknown to them, they were shown money cues. For example, they sat in rooms with pictures of money on the walls, performed tasked at computers with screensavers showing money, or read articles that included references to money. In no case did researchers call attention to these money cues.
Next, the researchers put the subjects of the experiment in various social situations to see how they would respond.
They found that exposure to money caused them to behave more independently and more selfishly:
- They took 70% longer to seek help for a project
- They took 50% more time to help others with a project or a task, such as picking up a pencil
- They preferred working alone on a task, even if working together with someone else required less work
- They sat further away from others.
As a general rule, unconscious reminders of money produce solitary tendencies in us: you view yourself as more self-sufficient. You are less likely to ask for help, and less likely to offer it to others.14
When you see reminders of money—even the mere presence of a currency symbol—you approach a transaction differently. It makes you prefer low prices over high quality. It causes you to make decisions based on price instead of the inherent qualities of what you’re purchasing. It also “brings to mind an exchange mentality, in which people consider what they are giving up for what they will get in return.”15
Next time you’re at Starbucks, notice what isn’t on the menu: a dollar sign.
Enjoying what you’ve read so far? Share it with your colleagues:
6. Why Starbucks prices end in .95 instead of .99
Prices on the Starbucks menu end in .95 instead of the more common .99. This might seem like a difference of only four cents, but it’s actually more complicated than that.
There are lots of good reasons why Starbucks would use .99-ending prices:
- .99-ending prices result in higher sales—in some cases 48% higher.
- .99-ending prices make you more likely to buy. In one study, when people saw .00-ending prices, they purchased 44.1% of the time. But when they saw .99-ending prices, they purchased 51.2% of the time.
- .99-ending prices make it harder to budget. In one study, researchers found that .99-ending prices made it difficult for people to mentally calculate values on a shopping list, resulting in overspending by 5.1%.
(If you’d like to know more, take a look at the massive post on the psychology of .99-ending pricing.)
If .99-ending prices are so effective, why do Starbucks prices end in .95?
Because, while .99-ending prices signal low cost, .95-ending prices signal high quality–which is more consistent with Starbucks’ brand.
In one study, researchers gathered 1,391 newspaper ads which listed prices. They found that .99-ending prices appeared most frequently, with .00 and .95 not far behind:
| Price ending | Share of all price endings |
| .99 | 21.5% |
| .00 | 15.6% |
| .95 | 13.8% |
They also found that 28.4% of all ads containing low-priced cues also had .99-ending prices, while 17% of ads without low priced cues contained .99-ending prices. These cues included a reference price, a savings amount, or language that implied pricing as a reason to purchase the product.
In other words, a greater-than-expected portion of .99-ending prices were associated with low prices.
However, this wasn’t true with .95-ending prices. They were not correlated with low-price appeal.16
Another study confirmed that .99-ending prices generated additional low-cost items marketed to price-conscious consumers. But for prestige products, .99-ending prices produced a contradictory signal. For these products, marketers tended to use .95-ending prices.17
Starbucks positions itself at the top of the market. People don’t buy coffee at Starbucks to save money. Instead, they spend a little extra to get a good cup of coffee. Prices ending in .95 help signal this.
Additionally, a cup of coffee priced $2.95 instead of $2.99 costs Starbucks 1.33% in lost revenue per transaction, but this is more than made up for by signaling that Starbucks is a high-quality brand.
Do people really think like this when they go to Starbucks?
You might be thinking… Nobody really thinks through all this when they order coffee. I certainly don’t.
Perhaps.
In her excellent book, How Emotions Are Made, Lisa Feldman Barrett writes that “any summary of the population is a statistical fiction that applies to no individual.”18
Or, to paraphrase Robert Sapolsky, summaries of human behavior explain a great deal but predict very little.19
Those rules apply here, too.
For example, we know that a population that doesn’t see a dollar sign on a menu spends 8% more per person on average. But we cannot predict whether you will spend 8% more, or 20% more, or no more than you would have spent had you seen a dollar sign. The dollar sign can explain why you might have spent more, but it cannot predict whether you will.
The same is true of the other phenomena I’ve described: the center stage effect, the compromise effect, the ability to easily process small numbers on the left and large numbers on the right, the attraction effect, and .95-price signaling.
We can observe behavior in aggregate, and then seek to explain that behavior.
But we cannot do the reverse: we cannot use an explanation to predict exactly how any single individual will act in a particular moment.
Next time you’re in line at Starbucks, it’s worth pondering:
- Am I a rational being?
- Does free will exist?
- Do I produce my choices, or do my choices produce me?
Enjoy your drink.
Want more content like this?
Roughly once per month I’ll send you a new article just like this one. You’ll learn how to make better decisions, understand your customers, and grow your revenue.
Who subscribes? CEOs, professors, marketers, designers, salespeople, non-profit leaders, and investors. Join them by signing up right now.
“I highly recommend subscribing to Kent Hendricks’s newsletter. Imagine if The Atlantic and Wait But Why had a child, who grew up to become an esteemed psychology researcher / game theorist. That’s kind of what reading his work is like.”
—Jeffrey Kranz, Co-founder/CEO, Overthink Group
- Christenfeld, N. (1995), “Choices from Identical Options.” Psychological Science, Vol 6, Issue 1.↩
- Dreze, X., Hoch, S. J., & Purk, M. E. (1995). “Shelf management and space elasticity.” Journal of Retailing.↩
- Attali, Y. and Bar-Hillel, M. (2003). “Guess Where: The Position of Correct Answers in Multiple Choice Test Items as a Psychometric Variable.” Journal of Educational Measurement.↩
- Valenzuaela, A. and Raghubir, P. (2009). “Position-based beliefs: The center-stage effect.” Journal of Consumer Psychology.↩
- Simonson, I. and Tversky, A. (1992). “Choice in context: Tradeoff contrast and extremeness aversion.” Journal of Marketing Research.↩
- Simonson, I. (1989). “Choice Based on Reasons: The Case of Attraction and Compromise Effects.” Journal of Consumer Research.↩
- Simonson, I. (1989). “Choice Based on Reasons: The Case of Attraction and Compromise Effects.” Journal of Consumer Research.↩
- Chang, C. (2012). “The Compromise Effect in Choosing for Others.” Behavioral Decision Making.↩
- Dehaene, S., et.al. (1993). “The Mental Representation of Parity and Number Magnitude.” Journal of Experimental Psychology.↩
- Tversky, A. and Kahneman, D. (1974). “Judgment Under Uncertainty: Heuristics and Biases.” Science.↩
- Dehaene, S., et.al. (1993). “The Mental Representation of Parity and Number Magnitude.” Journal of Experimental Psychology.↩
- Yang, S. S., Kimes, S. E. & Sessarego, M. M. (2009). “$ or Dollars: Effects of Menu-Price Formats on Restaurant Checks.” Cornell Hospitality Report.↩
- Lindstrom, M. (2011). “What Your Supermarket Knows about You.” Time.↩
- Vohs, K., Mead, N., Goode, M. (2006). “The Psychological Consequences of Money.” Science.↩
- Vohs, K. (2015). “Money Priming Can Change People’s Thoughts, Feelings, Motivations, and Behaviors: An Update on 10 Years of Experiments.” Journal of Experimental Psychology.↩
- Schindler, R. (2006). “The 99 price ending as a signal of a low-price appeal.” Journal of Retailing.↩
- Gendall, P., Fox, M. F. & Wilton, P. (1998). “Estimating the Effect of Odd Pricing.” Journal of Product and Brand Management.↩
- Barrett, L. (2017). How Emotions Are Made: The Secret Life of the Brain. Houghton Mifflin Harcourt.↩
- Sapolsky, R. (2017), Behave: The Biology of Humans at Our Best and Worst. Penguin.↩
